Learn how to use and navigate the analysis.
Step 1
Click on "Analysis" to enter the dashboard for your latest employee well-being survey.
(see the image below)
Step 2
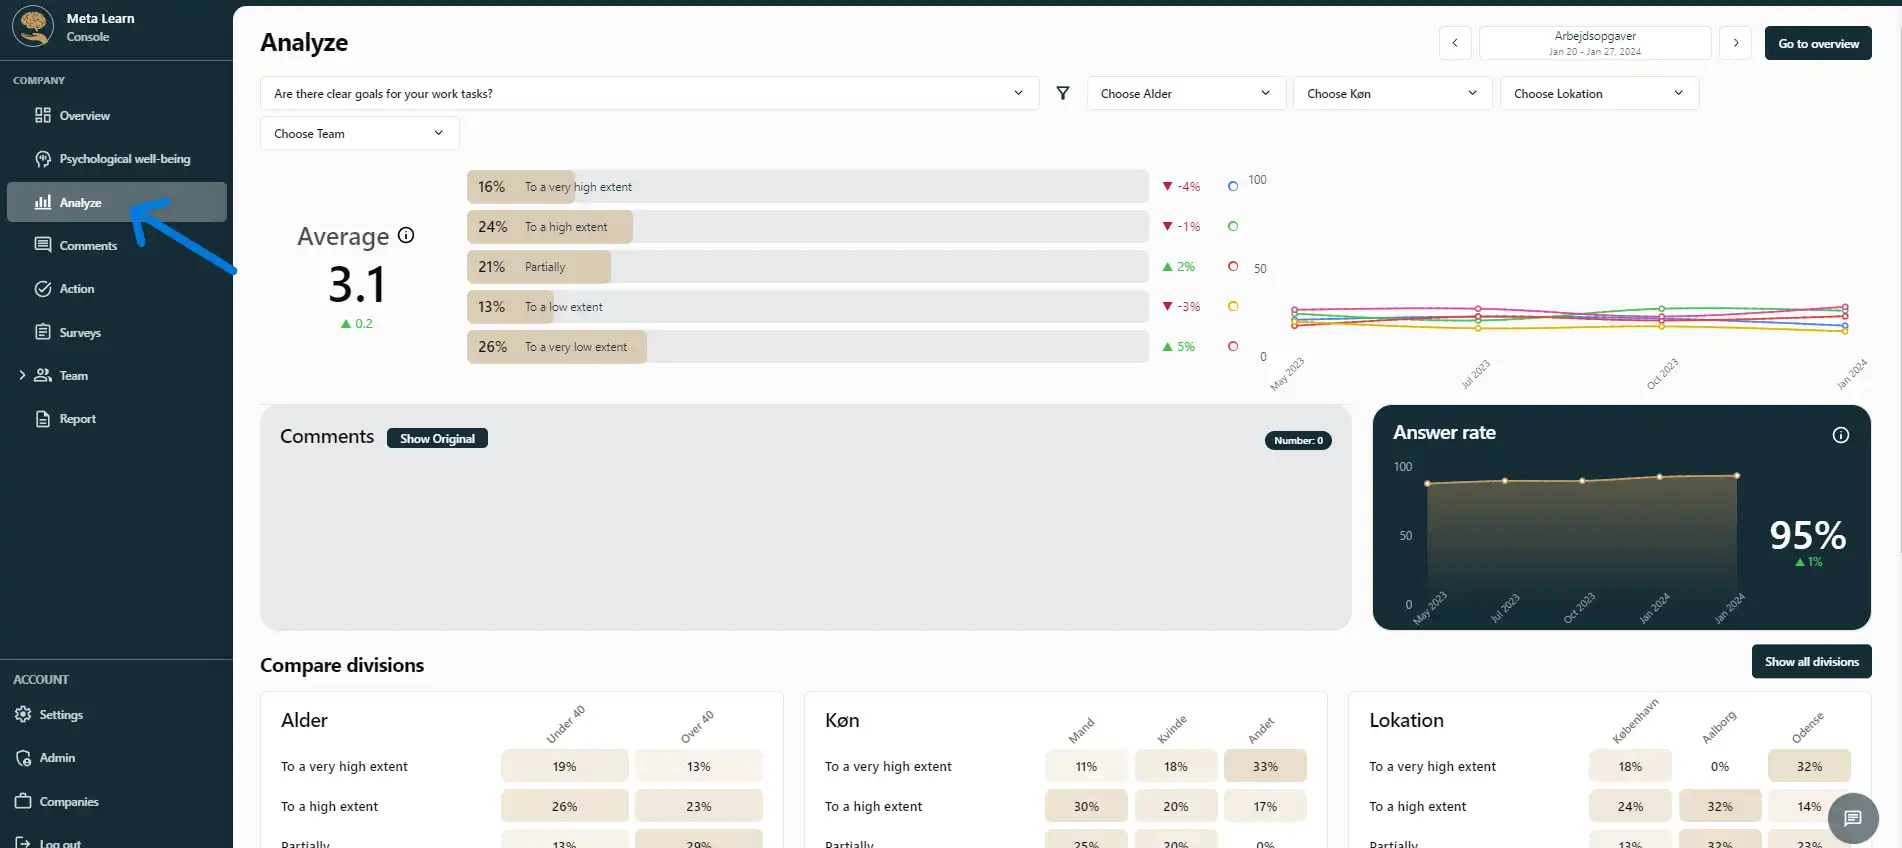
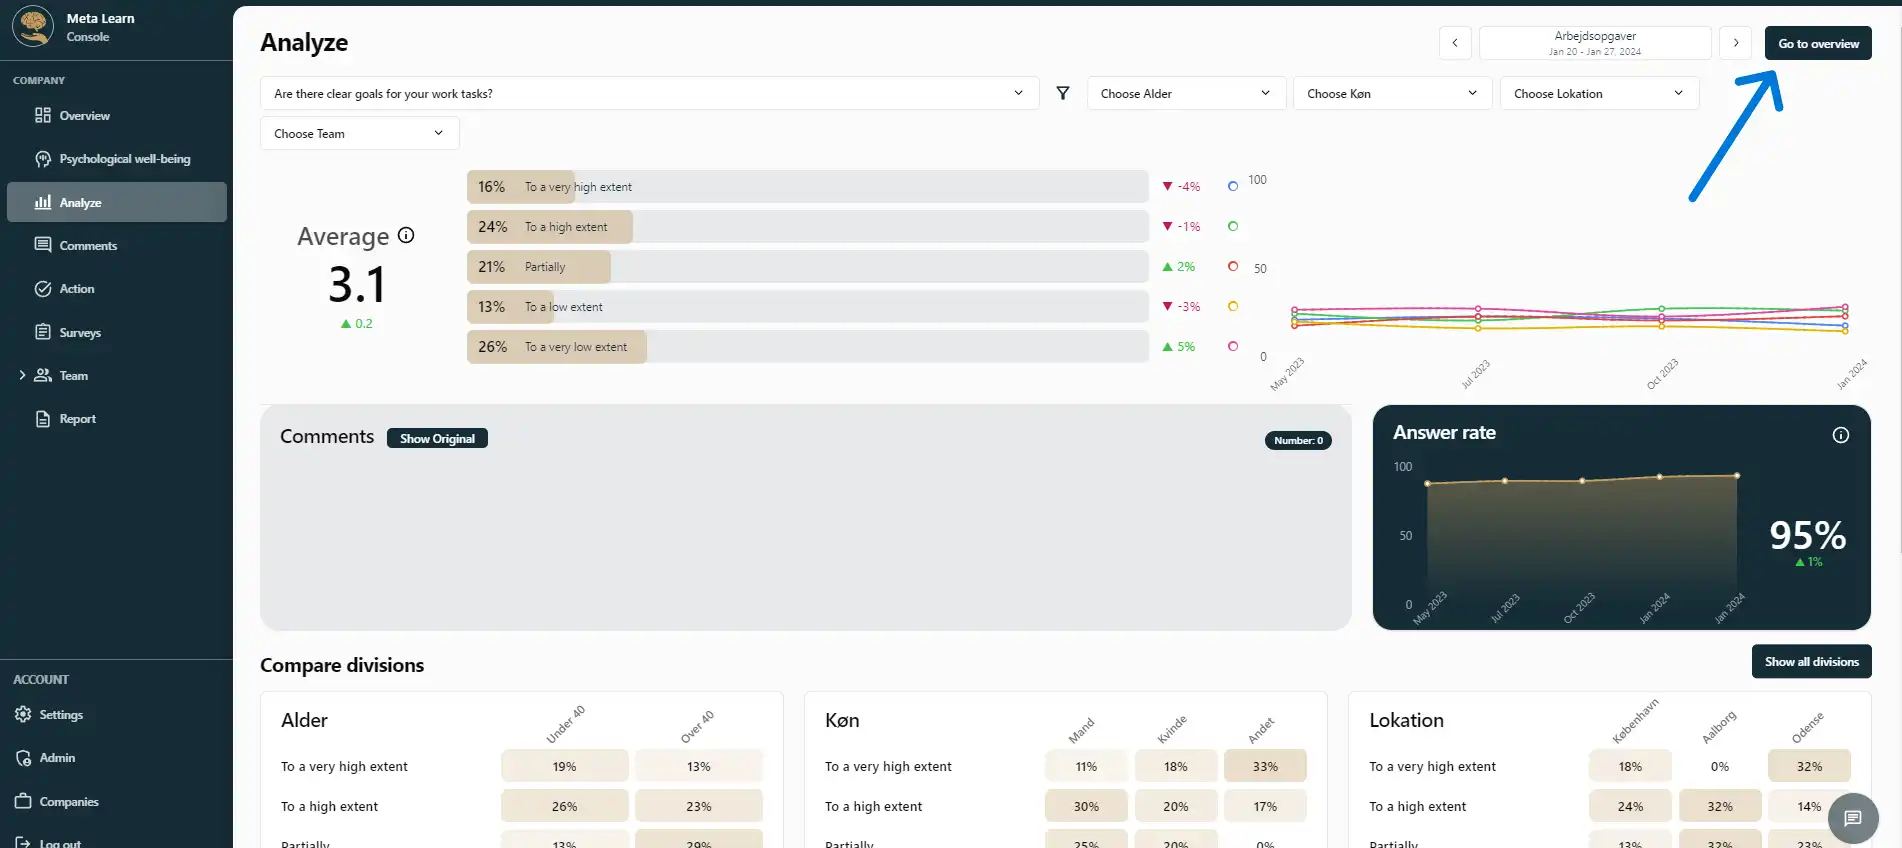
First, select which survey you want to view. If you have sent out multiple questionnaires to your employees, you can switch between them at the top or click on "Go to overview."
(see the image below)
Step 3
Now you can choose between the different questions that your employees have been asked. To switch between questions, click the down arrow to see all available questions.
(see the image below)

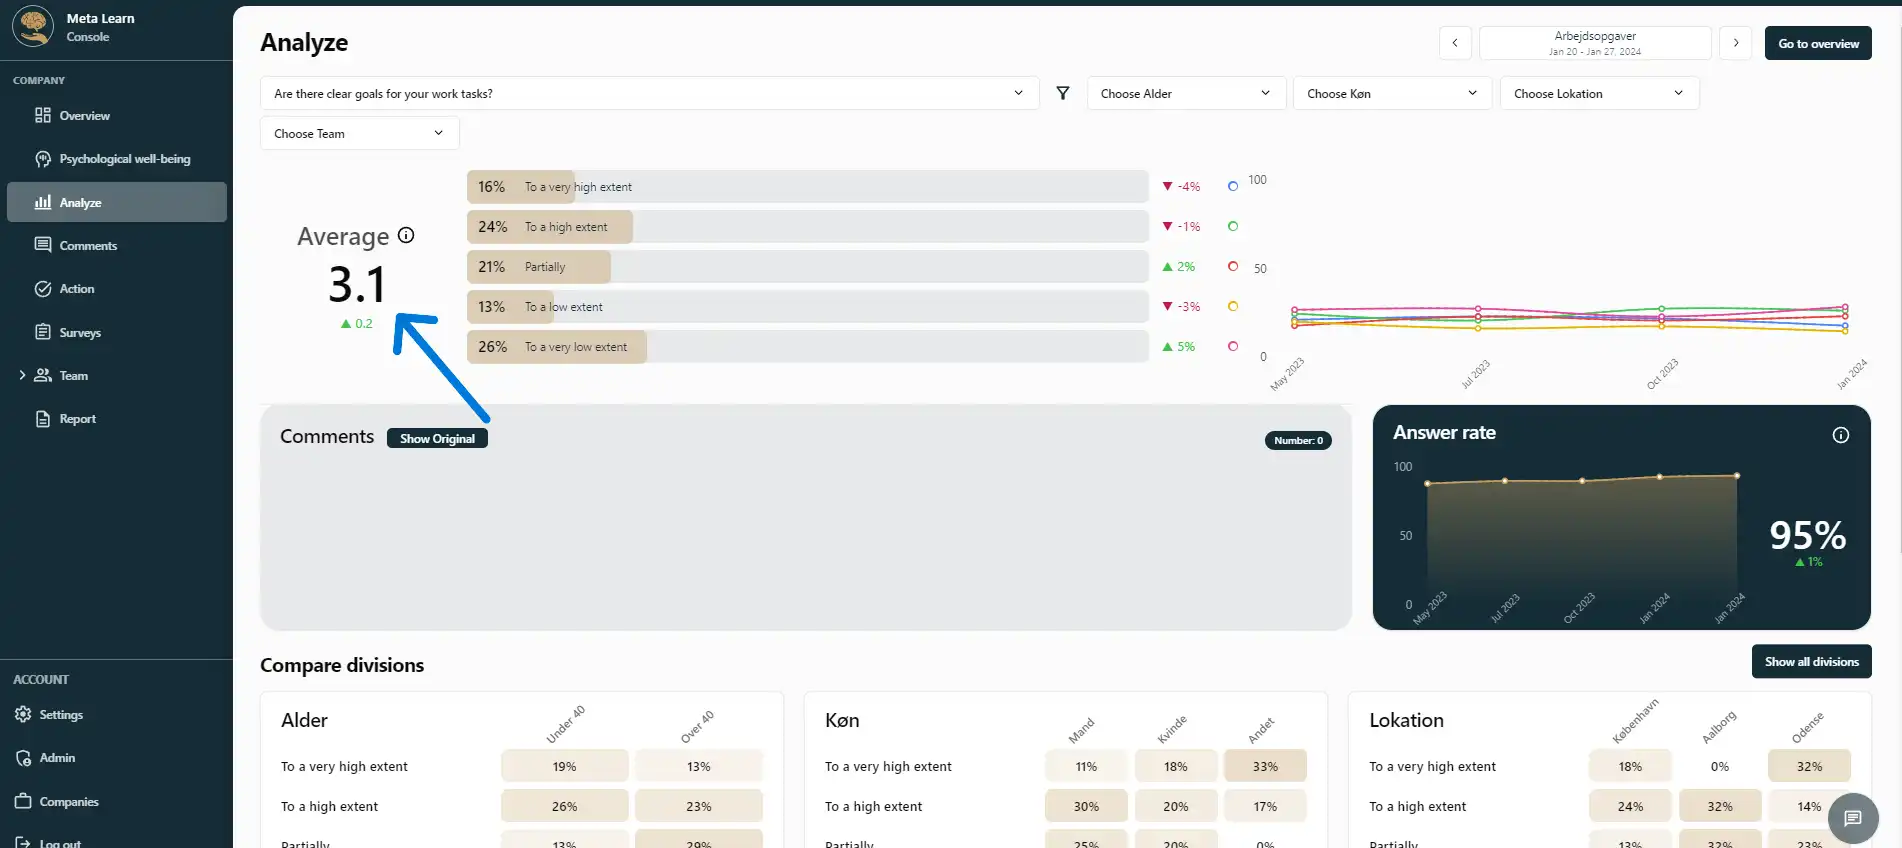
Step 4
Each question has an overall score that shows the average of the responses, allowing you to quickly and easily get an overview.
(see the image below)
Step 5
Here, you can see the distribution of responses, the response rate, and the historical development for the selected question.
(see the image below)
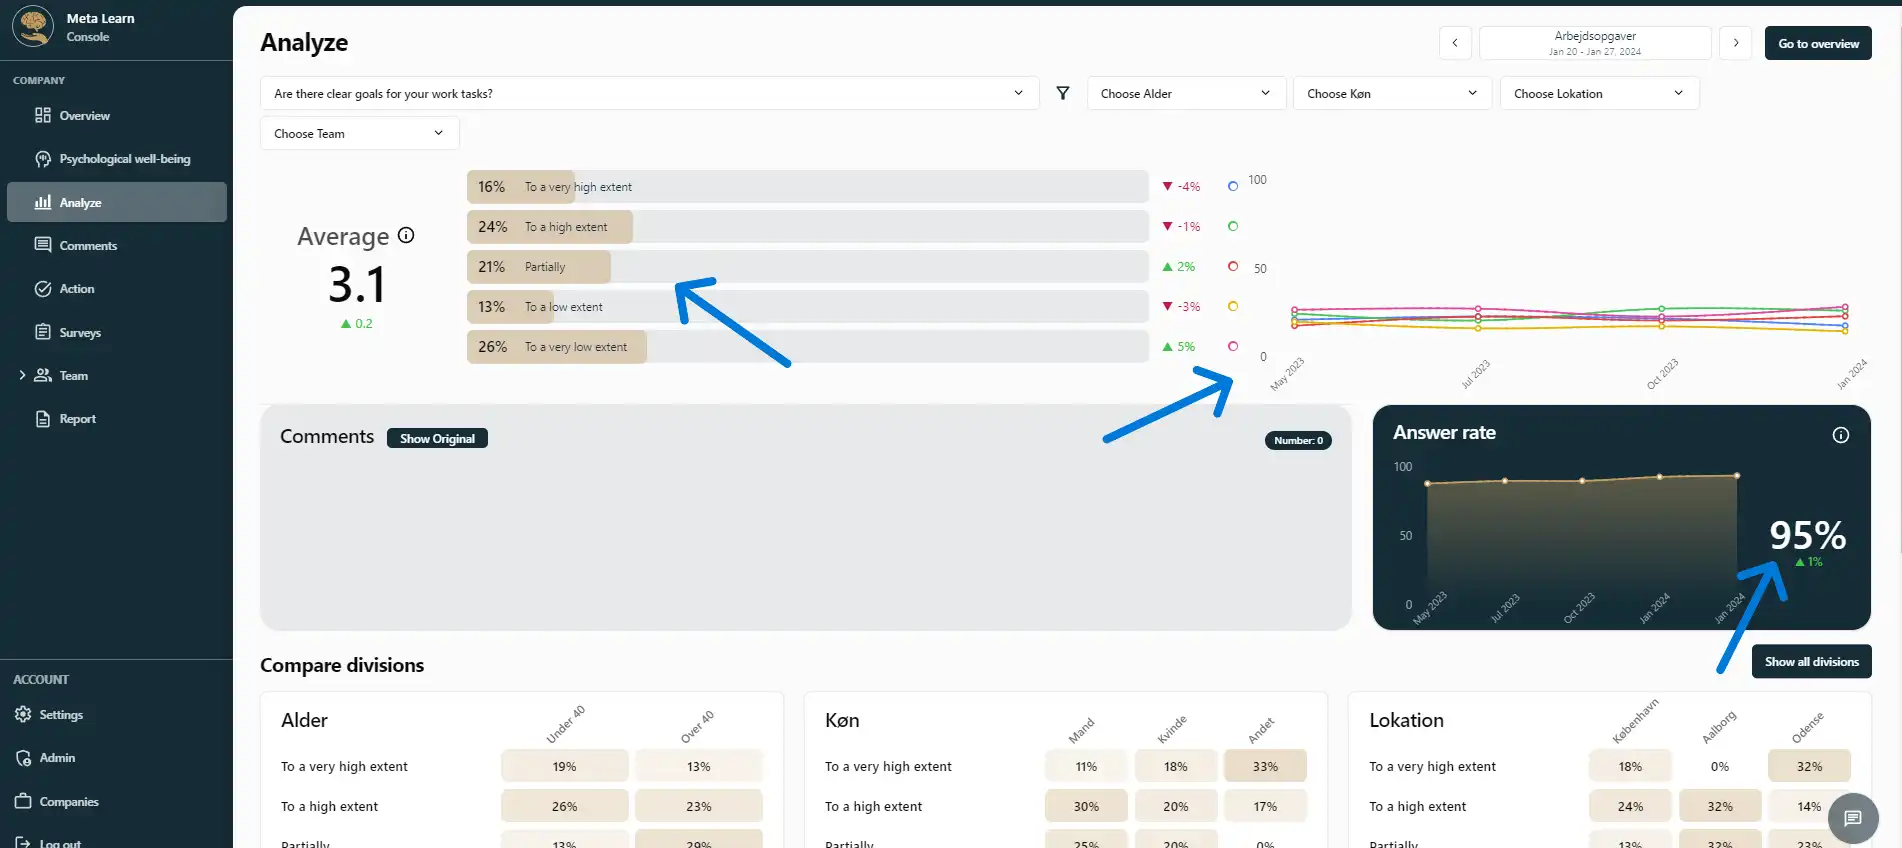
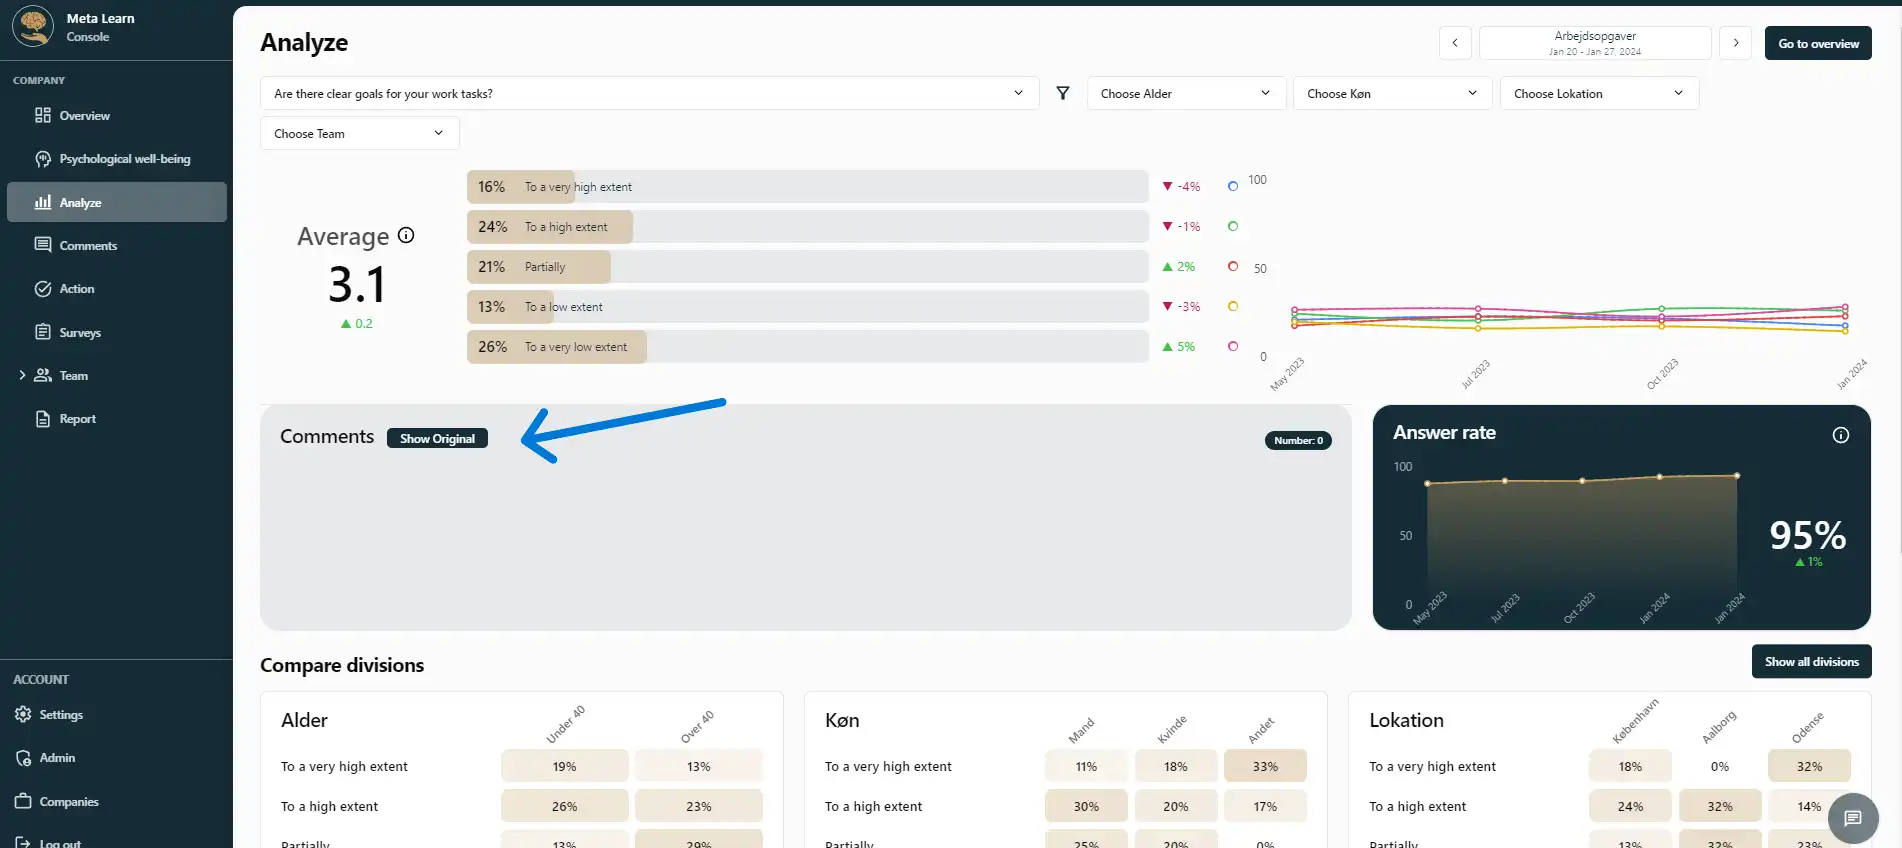
Step 6
If some employees have chosen to comment on a question, their comments will be displayed in the section below. You can also choose to view the original comments (in the language they were written in) or have them automatically translated by clicking "Translate."
(see the image below)
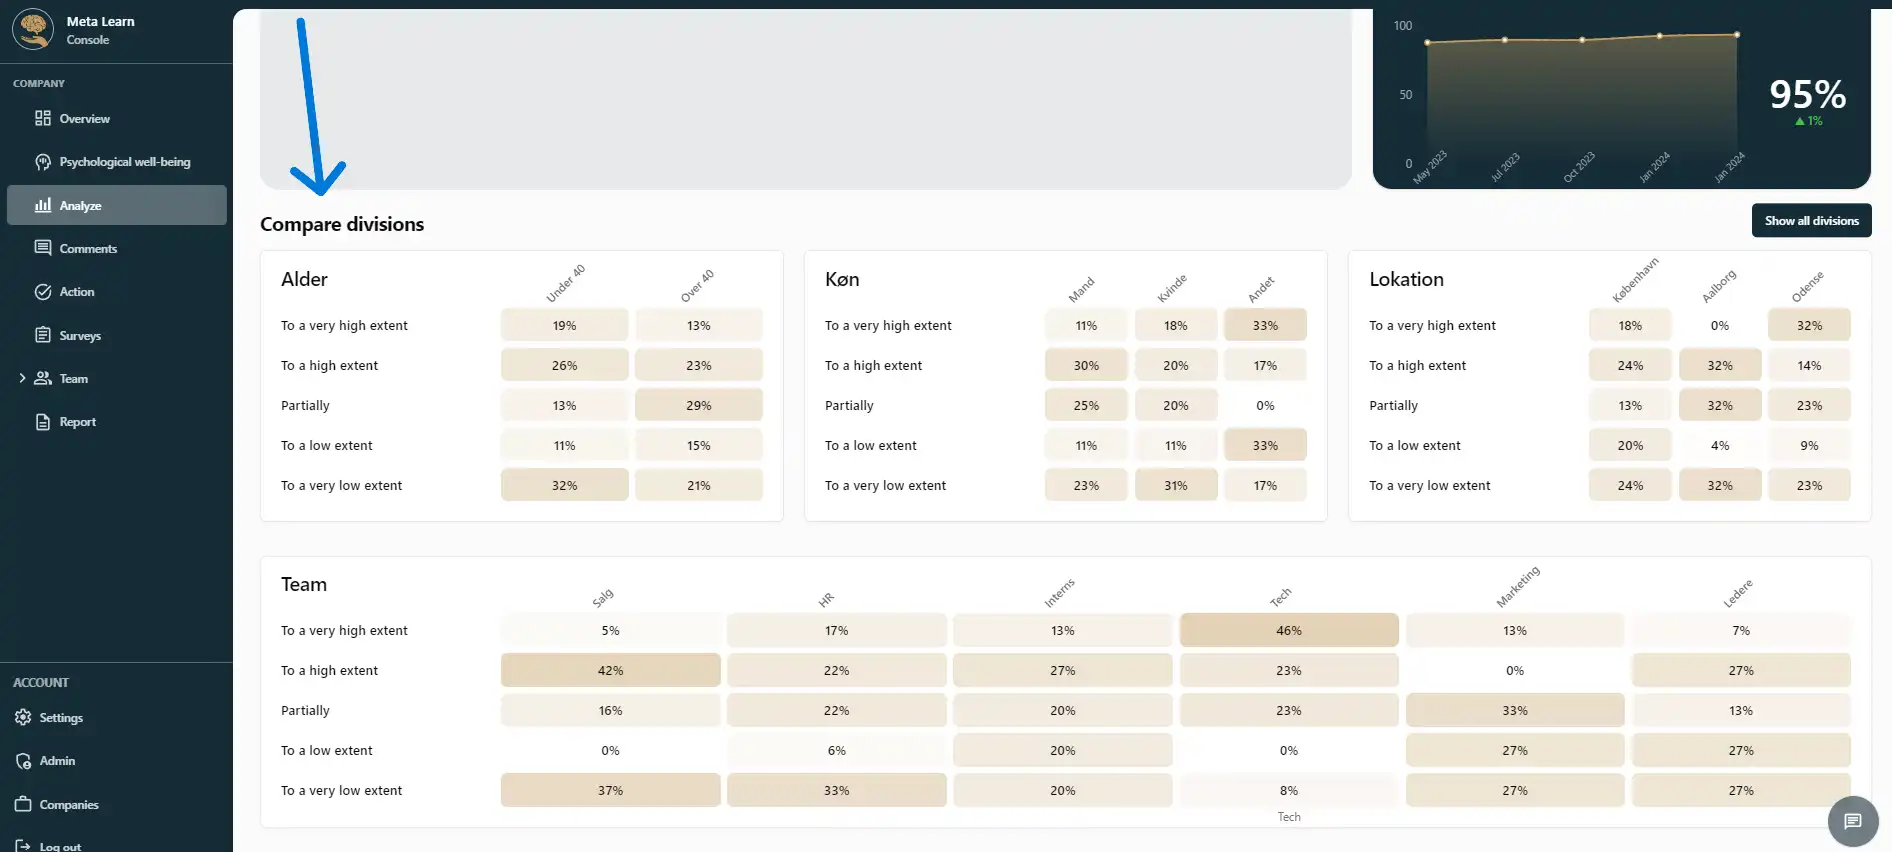
Step 7
Additionally, you can compare different divisions and quickly identify which departments or teams need more attention than others. Comparing divisions makes it easier to dive deeper into the data and understand your employees perfectly.
(see the image below)